The American Trends Panel survey methodology
Overview
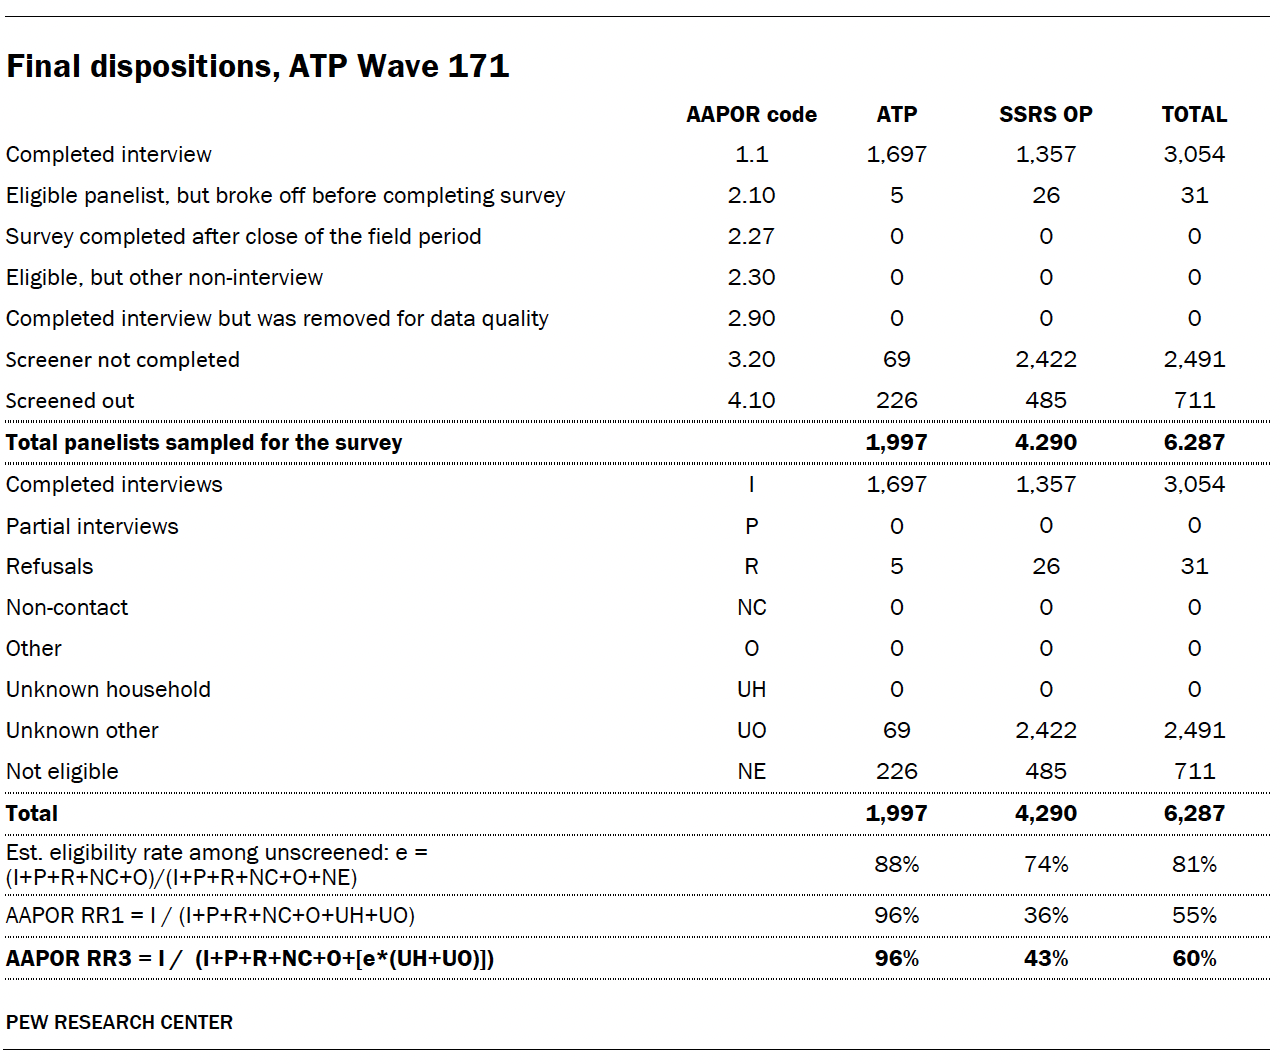
Data in this report comes from Wave 171 of the American Trends Panel (ATP), Pew Research Center’s nationally representative panel of randomly selected U.S. adults. The survey was conducted from May 13 to 26, 2025, among a sample of adults who are parents or guardians of any child age 12 or under. A total of 3,054 eligible parents responded out of 6,287 who were sampled, for a survey-level response rate of 60% (AAPOR RR3). This includes 1,697 respondents from the ATP and an additional 1,357 from the SSRS Opinion Panel (OP).
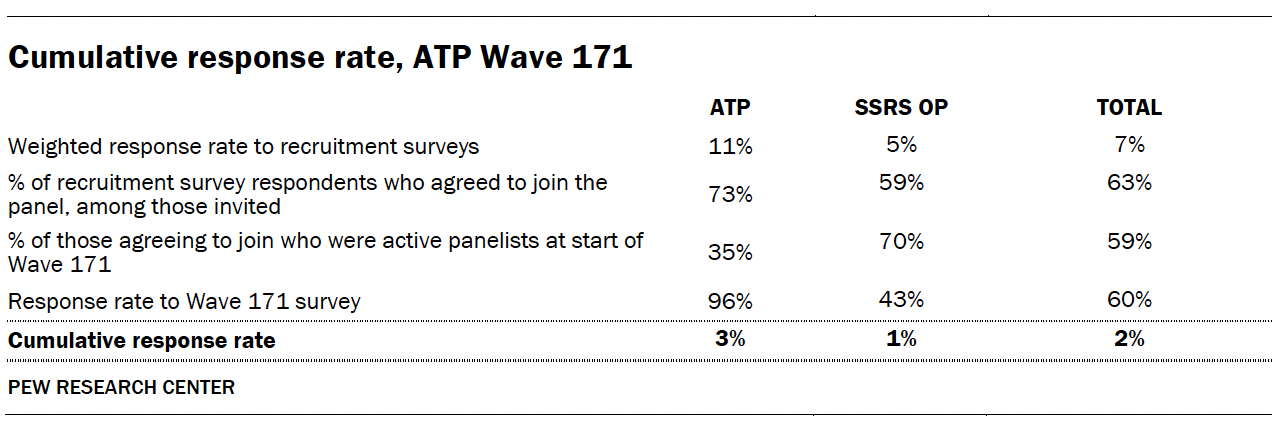
The cumulative response rate accounting for nonresponse to the recruitment surveys and attrition is 2%. The break-off rate among panelists who logged on to the survey and completed at least one item is 1%. The margin of sampling error for the full sample of 3,054 respondents is plus or minus 2.2 percentage points.
SSRS conducted the survey for Pew Research Center via online (n=2,935) and live telephone (n=119) interviewing. Interviews were conducted in both English and Spanish.
To learn more about the ATP, read “About the American Trends Panel.”
Panel recruitment
Since 2018, the ATP has used address-based sampling (ABS) for recruitment. A study cover letter and a pre-incentive are mailed to a stratified, random sample of households selected from the U.S. Postal Service’s Computerized Delivery Sequence File. This Postal Service file has been estimated to cover 90% to 98% of the population. Within each sampled household, the adult with the next birthday is selected to participate. Other details of the ABS recruitment protocol have changed over time but are available upon request. Prior to 2018, the ATP was recruited using landline and cellphone random-digit-dial surveys administered in English and Spanish.
A national sample of U.S. adults has been recruited to the ATP approximately once per year since 2014. In some years, the recruitment has included additional efforts (known as an “oversample”) to improve the accuracy of data for underrepresented groups. For example, Hispanic adults, Black adults and Asian adults were oversampled in 2019, 2022 and 2023, respectively.
Sample design
The overall target population for this survey was noninstitutionalized persons ages 18 and older living in the United States who are the parent or guardian of any child 12 or under. All active ATP members who had previously indicated they were the parent or guardian of any child 12 or under were invited to participate in this wave.
The ATP was supplemented with a sample from SSRS’s Opinion Panel. For the OP sample, SSRS took a probability proportional to size (PPS) sample of OP panelists with children 0 to 17 years, then screened respondents for selection. Only OP panelists who were parents or guardians of any child 12 or under were screened into the survey.
At the start of the survey, potentially eligible respondents were asked a series of screening questions to confirm their eligibility to complete the survey. For the ATP and OP samples, respondents were considered eligible if they indicated they were the parent or guardian of any child 12 or under.
Questionnaire development and testing
The questionnaire was developed by Pew Research Center in consultation with SSRS. The web program used for online respondents was rigorously tested on both PC and mobile devices by the SSRS project team and Center researchers. The SSRS project team also populated test data that was analyzed in SPSS to ensure the logic and randomizations were working as intended before launching the survey.
Incentives
All respondents were offered a post-paid incentive for their participation. ATP and OP respondents may receive the post-paid incentive in the form of a check or gift code to online merchants such as Amazon.com, Target.com or Walmart.com. Incentive amounts ranged from $5 to $15 for ATP respondents, and $5 to $10 for OP respondents, depending on whether the respondent belongs to a part of the population that is harder or easier to reach. Differential incentive amounts were designed to increase panel survey participation among groups that traditionally have low survey response propensities.
Data collection protocol
The data collection field period for this survey was May 13 to 26, 2025. Surveys were conducted via self-administered web survey or by live telephone interviewing.
For panelists who take surveys online: Postcard notifications were mailed to a subset of ATP panelists on May 12. Survey invitations were sent out in two separate launches: soft launch and full launch. 427 panelists were included in the soft launch (60 from ATP, 367 from OP), which began with an initial invitation sent on May 13. All remaining English- and Spanish-speaking sampled online panelists were included in the full launch and were sent an invitation on May 14.
Panelists participating online were sent an email invitation. ATP panelists received up to four email reminders if they did not respond to the survey, and OP panelists received up to two email reminders if they did not respond to the survey. ATP panelists who consented to SMS messages were sent an SMS invitation with a link to the survey and up to four SMS reminders. SSRS panelists who consented to SMS messages were sent an SMS invitation with a link to the survey and up to two SMS reminders.
For panelists who take surveys over the phone with a live interviewer: Prenotification postcards were mailed to ATP panelists on May 9. Soft launch took place on May 13 and involved dialing until a total of four interviews had been completed. All remaining English- and Spanish-speaking sampled phone panelists’ numbers were dialed throughout the remaining field period. Panelists who take surveys via phone can receive up to six calls from trained SSRS interviewers.
Data quality checks
To ensure high-quality data, Center researchers performed data quality checks to identify any respondents showing patterns of satisficing. This includes checking for whether respondents left questions blank at very high rates or always selected the first or last answer presented. As a result of this checking, no respondents were removed from the survey dataset prior to weighting and analysis.
Weighting
The ATP data is weighted in a process that accounts for multiple stages of sampling and nonresponse that occur at different points in the panel survey process. First, each panelist begins with a base weight that reflects their probability of recruitment into the panel. Base weights for OP respondents were provided by SSRS. The base weights for ATP and OP respondents were combined and scaled to account for the sample design.
The combined base weights were calibrated to align with the following estimated benchmarks for the population of parents or guardians of children ages 12 and under: age, gender, education, race/ethnicity, years living in the U.S. (among foreign born), volunteerism, voter registration, frequency of internet use, religious affiliation, party affiliation, census region, metropolitan status, the number of children ages 0 to 4, the number of children ages 5 to 12, and the number of children ages 13 to 17.
Because there are no official benchmarks for this population, weighting parameters were estimated using the eligible respondents to Wave 171 from the ATP sample. First, all ATP respondents who completed the screening questions on Wave 171, regardless of final eligibility, were weighted to match the full set of ATP members who were sampled on the following dimensions: age, gender, education, race/ethnicity, years living in the U.S. (among foreign born), volunteerism, voter registration, frequency of internet use, religious affiliation, party affiliation, census region and metropolitan status. These weights were then used to calculate weighting parameters based only on ATP respondents to Wave 171 who screened as eligible.
In the final step, the weights were trimmed at the 1st and 99th percentiles to reduce the loss in precision stemming from variance in the weights. Sampling errors and tests of statistical significance take into account the effect of weighting.
The following table shows the unweighted sample sizes and the error attributable to sampling that would be expected at the 95% level of confidence for different groups in the survey.

Sample sizes and sampling errors for other subgroups are available upon request. In addition to sampling error, one should bear in mind that question wording and practical difficulties in conducting surveys can introduce error or bias into the findings of opinion polls.
Dispositions and response rates
How family income tiers are calculated
Family income data reported in this study is adjusted for household size and cost-of-living differences by geography. Panelists then are assigned to income tiers that are based on the median adjusted family income of all American Trends Panel members. The process uses the following steps:
- First, panelists are assigned to the midpoint of the income range they selected in a family income question that was measured on either the most recent annual profile survey or, for newly recruited panelists, their recruitment survey. This provides an approximate income value that can be used in calculations for the adjustment.
- Next, these income values are adjusted for the cost of living in the geographic area where the panelist lives. This is calculated using price indexes published by the U.S. Bureau of Economic Analysis. These indexes, known as Regional Price Parities (RPP), compare the prices of goods and services across all U.S. metropolitan statistical areas as well as non-metro areas with the national average prices for the same goods and services. The most recent data available at the time of the annual profile survey is from 2022. Those who fall outside of metropolitan statistical areas are assigned the overall RPP for their state’s non-metropolitan area.
- Family incomes are further adjusted for the number of people in a household using the methodology from Pew Research Center’s previous work on the American middle class. This is done because a four-person household with an income of say, $50,000, faces a tighter budget constraint than a two-person household with the same income.
- Panelists are then assigned an income tier. “Middle-income” adults are in families with adjusted family incomes that are between two-thirds and double the median adjusted family income for the full ATP at the time of the most recent annual profile survey. The median adjusted family income for the panel is roughly $74,100. Using this median income, the middle-income range is about $49,400 to $148,200. Lower-income families have adjusted incomes less than $49,400 and upper-income families have adjusted incomes greater than $148,200 (all figures expressed in 2023 dollars and scaled to a household size of three). If a panelist did not provide their income and/or their household size, they are assigned “no answer” in the income tier variable.
Two examples of how a given area’s cost-of-living adjustment was calculated are as follows: the Pine Bluff metropolitan area in Arkansas is a relatively inexpensive area, with a price level that is 19.1% less than the national average. The San Francisco-Oakland-Berkeley metropolitan area in California is one of the most expensive areas, with a price level that is 17.9% higher than the national average. Income in the sample is adjusted to make up for this difference. As a result, a family with an income of $40,400 in the Pine Bluff area is as well off financially as a family of the same size with an income of $58,900 in San Francisco.
The respondents from the SSRS Opinion Panel oversample answered the same family income and household size questions, and their incomes were adjusted using the procedures detailed above. They were then assigned an income tier based on the median adjusted family income for the full ATP at the time of the most recent annual profile survey.
Advisory board
In addition to a team of subject area and methodological experts at Pew Research Center, the project was also guided by an advisory board of four members. This board included experts in a variety of areas related to parenting, children and technology.
- Jason Linden, National Board Certified Teacher
- Mary Madden, Adjunct Faculty, Communication, Culture & Technology (CCT) program, Georgetown University
- Desmond Upton Patton, Ph.D., M.S.W., Penn Integrates Knowledge (PIK) University Professor, University of Pennsylvania
- Jenny Radesky, M.D., Associate Professor of Pediatrics, University of Michigan Medical School
Advisers provided feedback at various key points during the report, including the questionnaire and a draft of the report. Pew Research Center remains solely responsible for all aspects of the research, including any errors associated with its products and findings. The feedback shared for this project is solely that of the advisers and does not express the views, policies or positions of their respective employers.
Focus groups
Pew Research Center worked with PSB Insights to conduct four online focus groups from March 4 to 6, 2025, with a total of 20 U.S. parents or guardians of at least one child ages 1 to 12.
The goal of these discussions was to explore parents’ views on topics we covered in the survey – including views of screen time and its impact, as well as navigating screen time decisions in parenting – in an in-depth manner. Each group lasted 90 minutes.
The discussions are not representative of all parents, nor do quotes selected represent the views of all participants in the groups. Instead, quotes included in the report are meant to provide color, context and nuance to the survey findings. They are pulled from larger discussion, and some quotes have been edited for concision and clarity.
Two groups were conducted with parents or guardians of at least one child ages 1 to 5, and two groups with parents or guardians of at least one child ages 6 to 12. Some participants had children in other age groups; they were asked to think about their child or children in the designated age range for each group.
Each group included five participants and was led by an experienced moderator using a discussion guide developed by Pew Research Center. The focus groups were conducted over a secure, online research platform with video and audio capabilities.
All participants were paid $150 for their time. Additionally, a $25 “early bird” raffle was offered to participants to encourage them to arrive early and ensure strong video and audio connections. In each group, one participant among those who logged into the groups more than 10 minutes before the scheduled start was randomly selected to win the extra $25.
Recruitment
The vendor worked with a qualitative recruitment specialist to target, recruit, and screen potential participants of this study. To be eligible, participants had to meet six criteria:
- They had to be living in the United States
- They had to be 18 years of age or older (19 or older if living in Nebraska or Alabama, 21 or older if living in Mississippi)
- They had to be the parent or guardian of at least one child ages 1 to 12
- They must not have participated in a marketing research focus group or one-on-one interview in the past three months
- Neither they nor someone in their household were working in marketing/marketing research/consulting for any company, advertising/public relations for any company, or a media company
- They had access to a computer with high-speed internet access and a working webcam.
Eligible participants also had to be willing to contribute to the research, able to attend the focus group on the set date and time and sign an informed consent form before they could participate.
The research team overrecruited participants to account for “no-shows,” as well as participants who may experience other issues preventing participation. Those who showed up for the group but did not ultimately participate were also given the incentive.
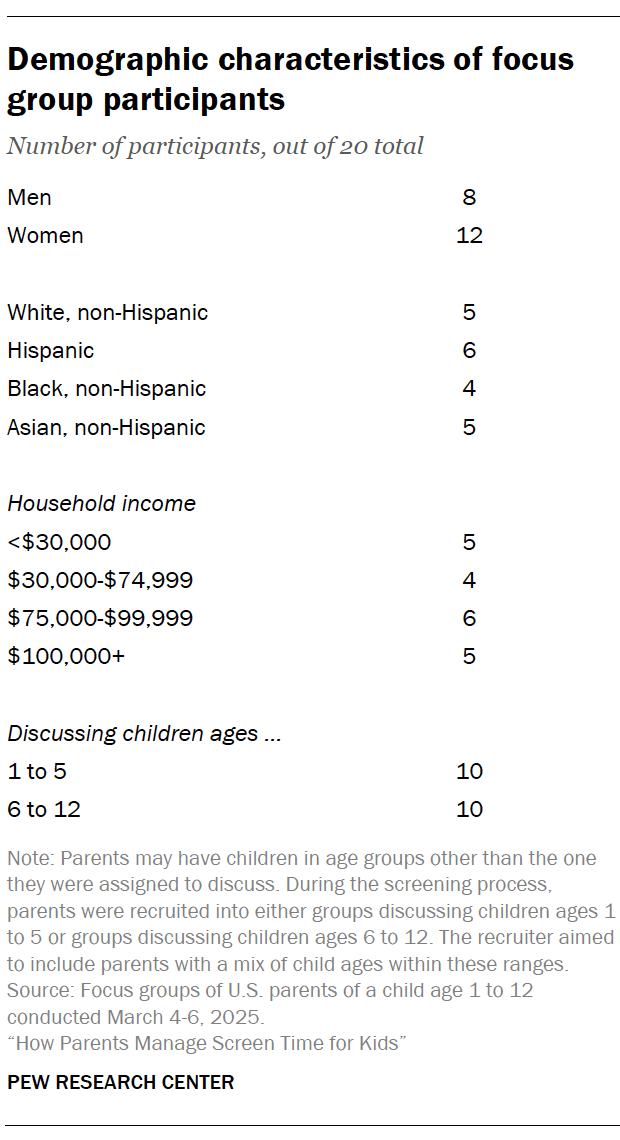
The recruiter collected parents’ demographic information such as race and ethnicity, household income, education level, gender, number of children, urbanicity and ages of children. When prioritizing participants to include in the groups, the recruiter and research team considered this information with the goal of including a range of demographics in the groups, as well as parents with children of various ages. Refer to the table at right for a demographic breakdown of the final 20 participants.
Discussion
A professional moderator from PSB Insights conducted the online focus groups on behalf of Pew Research Center.
The moderator followed the same discussion guide for all focus groups but covered some topics in more depth than others depending on the age of children being discussed and the flow of the discussion. After introductions and ground rules, the guide covered the following topics:
- What screen time looks like for their kids
- Views of screen time and its impact
- Navigating screen time decisions
- Parents’ own technology use
- AI and kids
The full discussion guide is available upon request.
Great Job Sara Atske & the Team @ Pew Research Center Source link for sharing this story.

