

As it passes its midway point, 2025 is on track to be the second or third warmest year on record, Carbon Brief analysis shows.
However, it is very unlikely to beat 2024 as the hottest year.
This is not surprising, as 2024’s record temperatures were boosted by a strong El Niño event that has now faded.
The analysis also finds there is a less than 10% chance that average temperatures in 2025 will be more than 1.5C above pre-industrial levels.
However, with long-term warming trending strongly upward and, potentially, accelerating, the world is expected to firmly pass the Paris Agreement 1.5C target – which refers to long-term warming, rather than annual temperatures – in the next five years.
In this latest state of the climate quarterly update, Carbon Brief finds:
- So far, 2025 has seen record warm temperatures in January, the third warmest February and June and the second warmest monthly temperatures for March through May on record.
- The world, as a whole, has warmed approximately 1.1C since 1970 – and around 1.4C since the mid-1800s.
- Neutral El Niño Southern Oscillation (ENSO) conditions are expected to persist for the remainder of the year and into 2025.
- Arctic sea ice extent hit record low levels for much of June and into early July – and remains well below the historical range (1979-2010).
Second-warmest first six months of the year
In this assessment, Carbon Brief analyses records from five different research groups that report global surface temperature records: NASA, NOAA, Met Office Hadley Centre/UEA, Berkeley Earth and Copernicus/ECMWF.
These records are combined into an aggregate that reflects a single best-estimate, following the approach used by the World Meteorological Organization (WMO).
The first six months of 2025 have been very warm, each of them coming in the top-three warmest on record across all the different scientific groups that report on global surface temperatures. This is despite the presence of moderate La Niña conditions in the tropical Pacific at the start of the year, which typically suppress global temperatures.
The table below shows the rank of each month in 2025 relative to all the months since the dataset began (1850 for NOAA, Hadley/UAE and Berkeley Earth, 1880 for NASA, and 1940 for Copernicus/ECMWF). Hadley/UAE has been unusually slow in reporting data in 2025 and currently only has global mean surface temperature value available up to February.
It demonstrates how January 2025 was the warmest January on record in the WMO aggregate, March, April and May the second warmest and February and June the third warmest.
| Monthly rank | NASA | NOAA | Hadley/UAE | Berkeley Earth | Copernicus / ECMWF | WMO avg |
|---|---|---|---|---|---|---|
| Jan | 1st | 1st | 1st | 1st | 1st | 1st |
| Feb | 3rd | 3rd | 3rd | 3rd | 3rd | 3rd |
| Mar | 2nd | 1st | 1st | 2nd | 2nd | |
| Apr | 2nd | 2nd | 2nd | 2nd | 2nd | |
| May | 2nd | 2nd | 2nd | 2nd | 2nd | |
| Jun | 3rd | 3rd | 3rd | 3rd | 3rd |
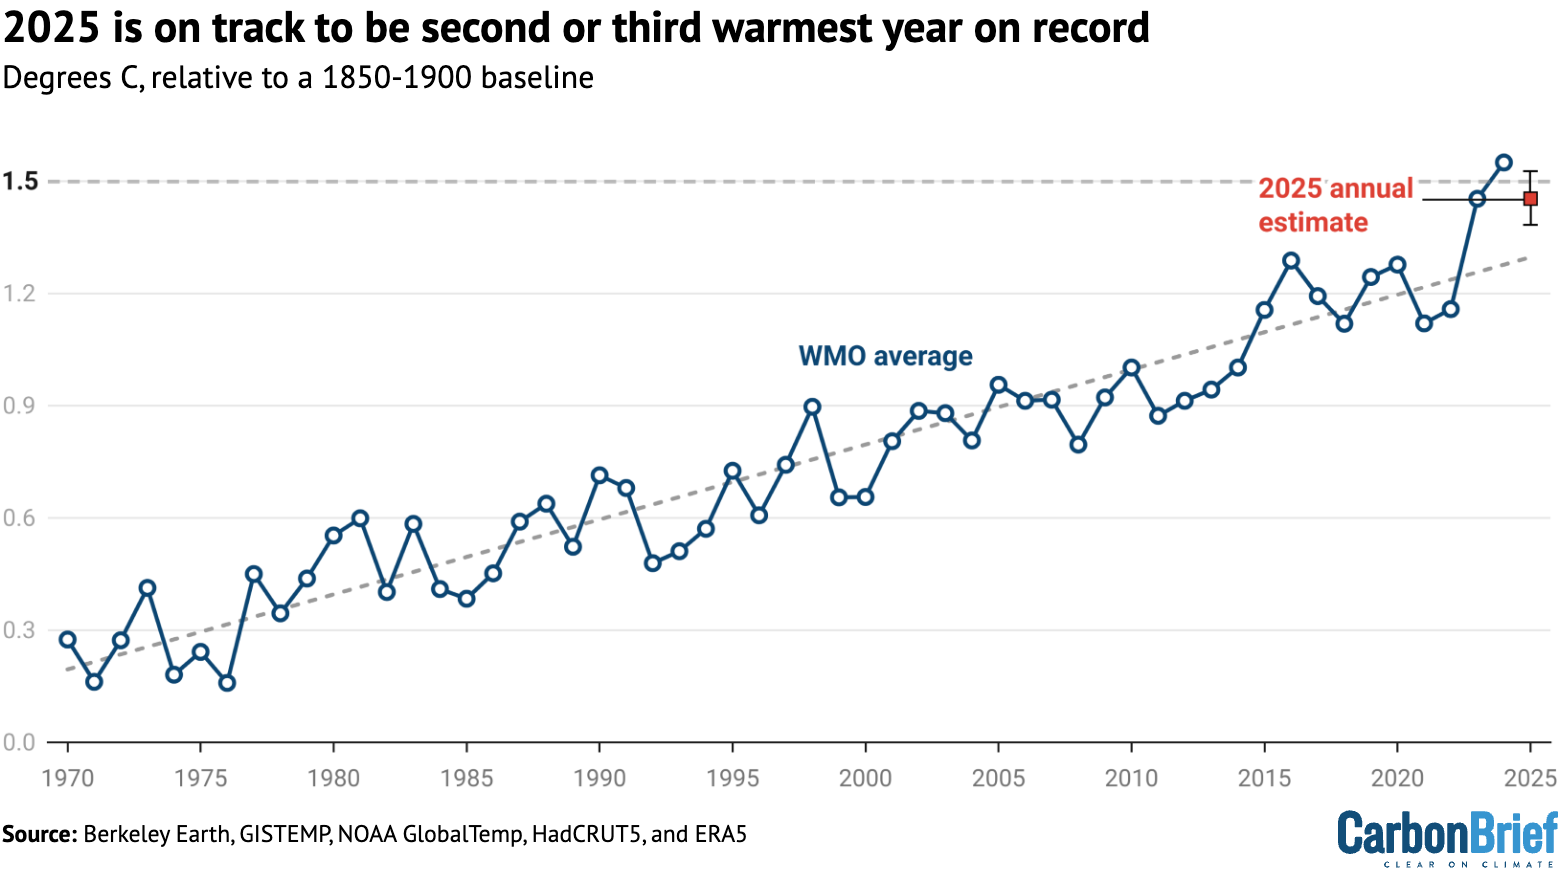
When combined, the first six months of the year in 2025 were the second warmest first half of the year in the historical record. Temperatures averaged at just 0.08C below the record set in 2024 after the peak of a strong El Niño event, as shown in the figure below.
When combined, the first six months of the year in 2025 were the second warmest first half of the year in the historical record. Temperatures averaged at just 0.08C below the record set in 2024 after the peak of a strong El Niño event, as shown in the figure below.

Global surface temperature is currently around 1.4C above preindustrial levels – in-line with the best estimate of the human contribution to global warming. Most of this warming – around 1.1C – has happened just since 1970.
However, global surface temperatures have been declining in May, April and June from highs at the beginning of 2025. This is driven in part by continued cooling of sea surface temperatures after an El Niño-driven peak in early 2024, as well as a contribution from short-lived weak La Niña conditions at the start of the year.
The figure below shows a range of different forecast models for ENSO conditions for the rest of this year, produced by different scientific groups. The values shown are sea surface temperature variations in the tropical Pacific – known as the El Niño 3.4 region – for overlapping three-month periods.
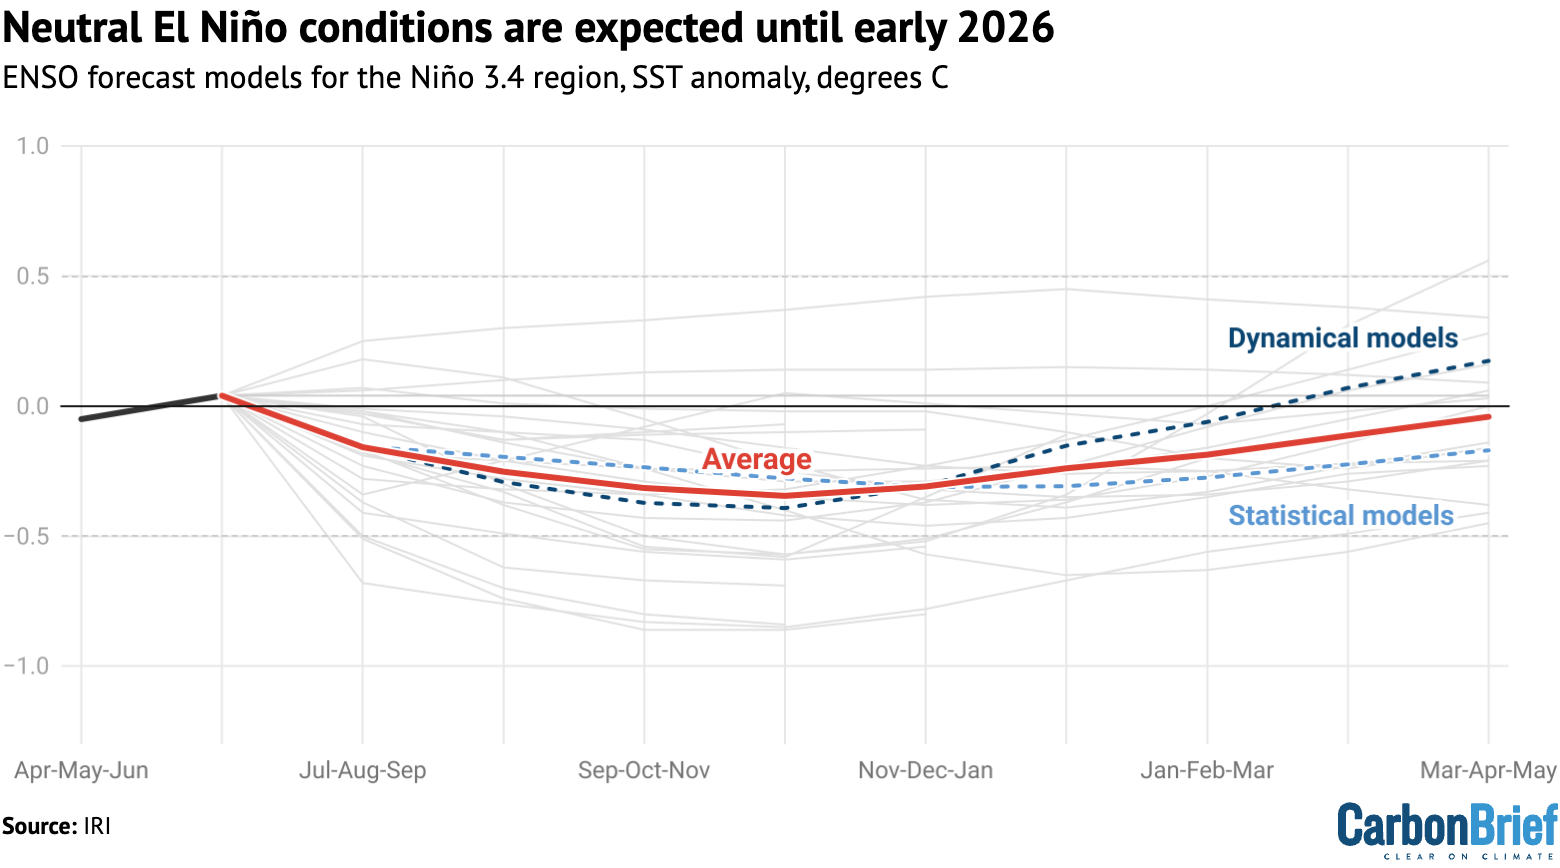
Neutral ENSO conditions are expected to persist through the start of 2026 in most models, with a handful of models showing a return to weak La Niña conditions (defined as El Niño 3.4 region sea surface temperatures under-0.5C) in the autumn and winter months. No models expect the development of El Niño conditions in 2025 and early 2026.
On track to be the second or third warmest year
Carbon Brief has created a projection of what the final global average temperature for 2025 will likely be by looking at the relationship between January-June temperatures and the annual average for each year since 1970. The projection also takes into account ENSO conditions in the first six months of the year and their projected development.
The analysis includes the estimated uncertainty in 2025 outcomes, given that temperature averages from only the first quarter of the year are available so far.
The chart below shows the expected range of 2025 temperatures using the WMO aggregate – including a best-estimate (red) and year-to-date value (yellow). Temperatures are shown with respect to the pre-industrial baseline period (1850-1900).
Carbon Brief’s projection suggests that 2025 is virtually certain to be one of the top-three warmest years on record, with a best-estimate suggesting that global average temperatures will be approximately equal to 2023.
Currently, there is a less than 1% chance of 2025 being the warmest year on record, a 51% chance of it being the second warmest and a 49% chance of it being the third warmest. There is a roughly 9% chance that 2025 annual temperatures will exceed 1.5C above pre-industrial levels.
(A single year exceeding 1.5C is not equivalent to a breach of the Paris Agreement goal to limit temperature increases to 1.5C, which has been widely interpreted to mean temperature averages over 20 years.)
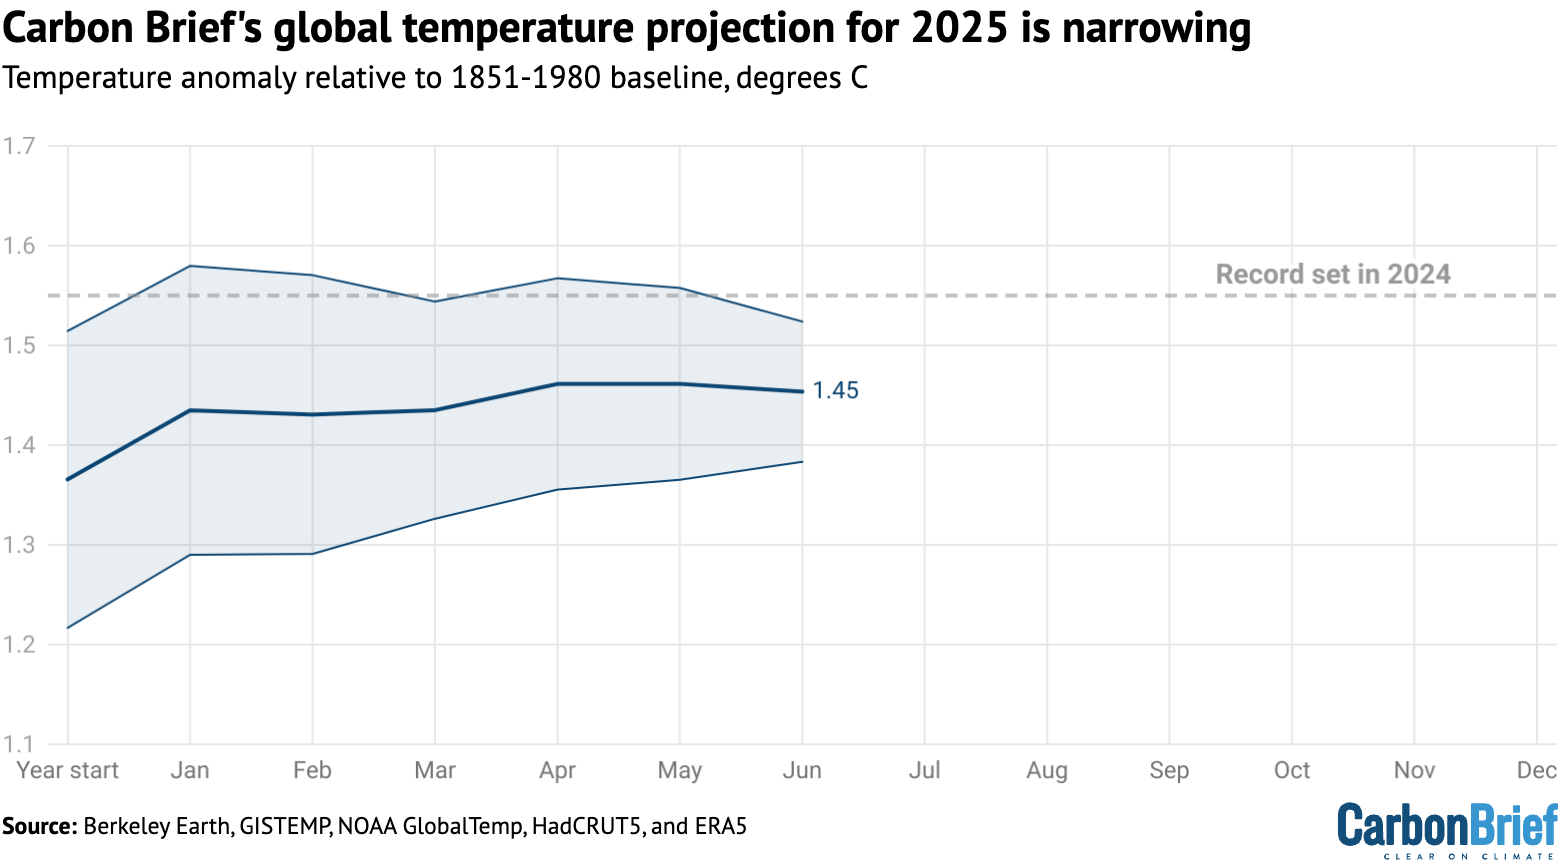
The figure below shows Carbon Brief’s estimate of 2025 temperatures using the WMO aggregate, both at the beginning of the year and once each month’s data has come in. The estimate jumped notably after 2025 saw the warmest January on record, but has been relatively stable over the past six months.
Record or near-record warmth in many regions
While global average temperatures are an important indicator of changes to the broader climate system over time as a result of human activities, these impacts will differ as some regions experience more rapid warming or extreme heat events than is reflected in the global average.
The figure below shows the temperature anomalies for the first six months of the year relative to the 1951-1980 baseline period used by Berkeley Earth. Virtually the whole planet except a small area off the coast of Baja Mexico and in Antarctica saw temperatures warmer than that baseline, with much of Europe and Asia around 2C warmer than the 1951-1980 period.
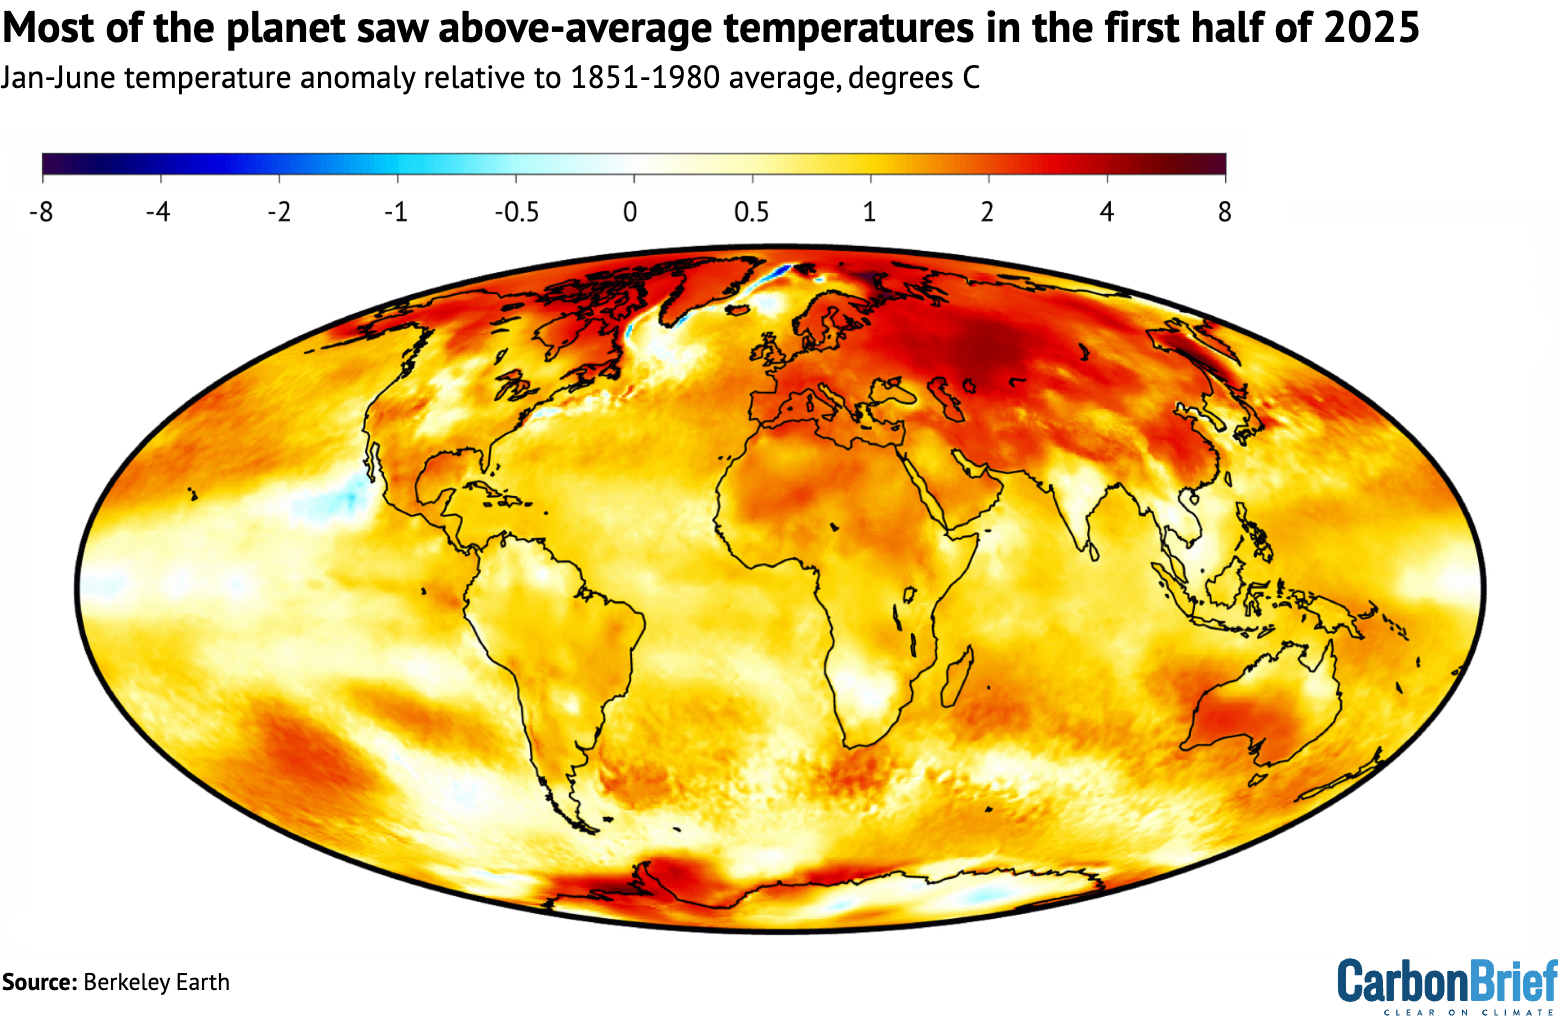
A number of areas saw record warm temperatures over January through to June in the Berkeley Earth dataset, compared to all prior years since the global temperature record began in 1850.
The figure below shows areas of record warm temperatures in dark red; there were no areas with record – or even top-five – cool temperatures. (For more, read Carbon Brief’s factcheck on how climate change is not making extreme cold more common).

Notable areas of record warmth include much of China, south-west Australia and the Mediterranean region. Western Europe, in general, was quite warm, though most land areas did not see a new record set. Overall, approximately 7% of the surface saw record warming in the first six months of the year.
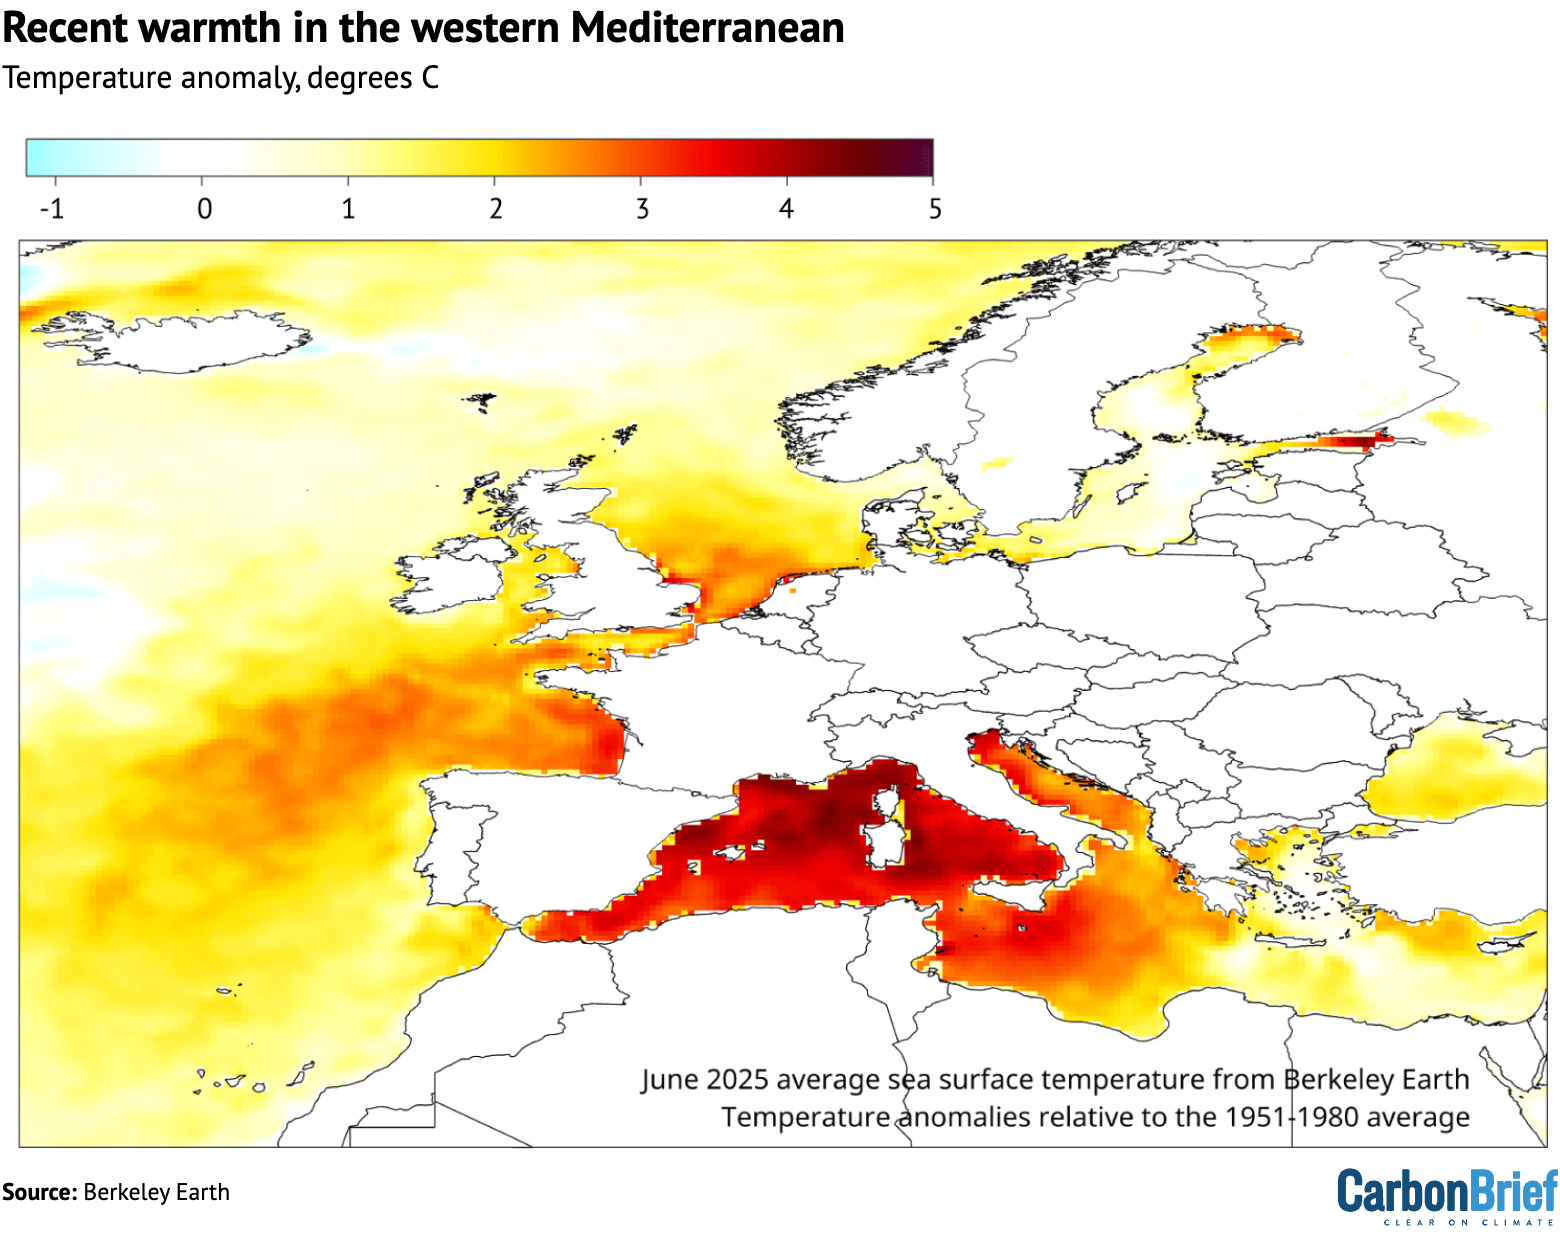
In June, the western Mediterranean saw particularly exceptional warmth, as shown in the figure below. This marine heatwave was driven by a combination of short-term natural variability on top of the long-term warming trend in the region.
The temperature increase in the western Mediterranean region in July – relative to the long-term warming trend – represents the largest short-term increase in temperatures for the region since June 2003, which was a precursor to a devastating heatwave that is believed to have killed 70,000 people.
Record-low Arctic sea ice extent in June
Arctic sea ice extent saw record lows for much of June 2025 and early July, moving out of record territory in mid-July, but remaining far below the historical range (1979-2010).
Antarctic sea ice extent has been at the low end of the historical range for much of the year, but has not set new records aside from a brief period in late February and early March.
The figure below shows both Arctic and Antarctic sea ice extent in 2025 (solid red and blue lines), the historical range in the record between 1979 and 2010 (shaded areas) and the record lows (dotted black line).
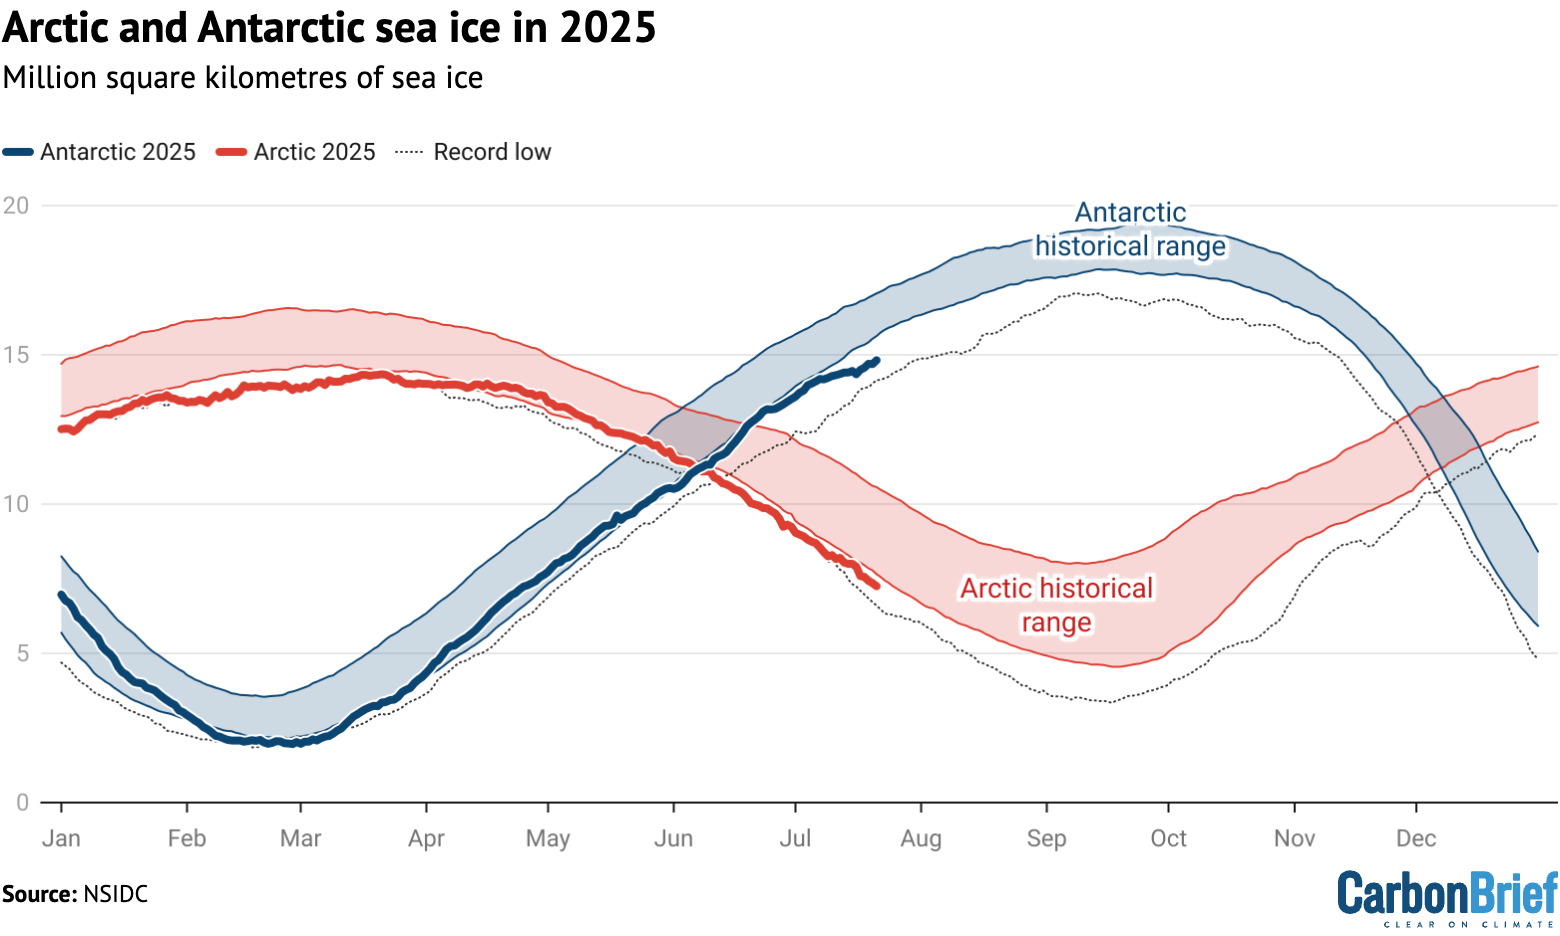
Unlike global temperature records, which only report monthly averages, sea ice data is collected and updated on a daily basis, allowing sea ice extent to be viewed up to the present.
However, this dataset – which has been continuously measured by satellites and assembled by the US National Snow and Ice Data Center (NSIDC) since 1979 – may soon be less available.
The US Department of Defence is planning to cease provision of satellite sea ice extent data to the NSIDC at the end of July. While some other satellite instruments can be used to help fill in the gaps, the change will degrade the scientific ability to effectively track this key climate variable.
Great Job Zeke Hausfather & the Team @ Carbon Brief Source link for sharing this story.


