The groundwork for the Federal Reserve’s worst-case scenario appears to be unfolding.
At any given time, there are one or more significant market headwinds threatening to drive the benchmark S&P 500 (^GSPC 0.78%), iconic Dow Jones Industrial Average (^DJI 0.47%), and innovation-inspired Nasdaq Composite (^IXIC 0.98%) lower.
For instance, the S&P 500’s Shiller Price-to-Earnings Ratio, which is based on average inflation-adjusted earnings over the prior 10 years, recently achieved a closing multiple of almost 39. This makes the current bull market the third-priciest when back-tested 154 years. Historically speaking, when valuations get extended to the upside, the S&P 500, Dow Jones, and/or Nasdaq Composite eventually fall 20%, or considerably more.
For Federal Reserve Chair Jerome Powell and the nation’s central bank, these correlative events and historical headwinds aren’t of much concern — but there is one exception.
Nothing scares the Fed more than the prospect of stagflation, which is characterized by a period of higher inflation, slower economic growth, and generally higher unemployment. While Powell and the Fed aren’t panicking, Donald Trump’s tariff and trade policy certainly has the central bank more concerned about the prospects of stagflation in America than they were prior to the president’s January inauguration.
President Trump speaking with reporters. Image source: Official White House Photo by Andrea Hanks, courtesy of the National Archives.
The groundwork for the Fed’s worst-case scenario is being laid
Normally the Federal Reserve is doing its work at one end of the spectrum or the other. If the economy is firing on all cylinders, its primary goal is to keep inflation (rising prices) from getting out of hand. A growing economy is generally going to exhibit a healthy job market.
On the other hand, if U.S. economic growth has weakened or a recession has taken hold, the Fed will turn its attention to spurring job growth by lowering the federal funds rate. When the economy is weak, the prevailing rate of inflation tends to decline.
Stagflation presents a nightmare scenario for Jerome Powell and the Fed because there’s no blueprint for how to approach it. Lowering interest rates to spur growth can fan the flames of higher-than-desired inflation. Meanwhile, raising interest rates to cool the prevailing rate of inflation can weaken an already stumbling economy and jobs market. Regardless of the actions the central bank employs, it tends to be bad news for workers and the stock market.
The concern is that stagflation fears are mounting specifically because of President Trump’s tariff and trade policy.
In early April, the president unveiled a 10% global tariff rate, as well as higher “reciprocal tariffs” on dozens of countries deemed to have adverse trade imbalances with America. Since initially introducing these reciprocal tariffs, numerous pauses, adjustments, and trade deals have been hashed out.
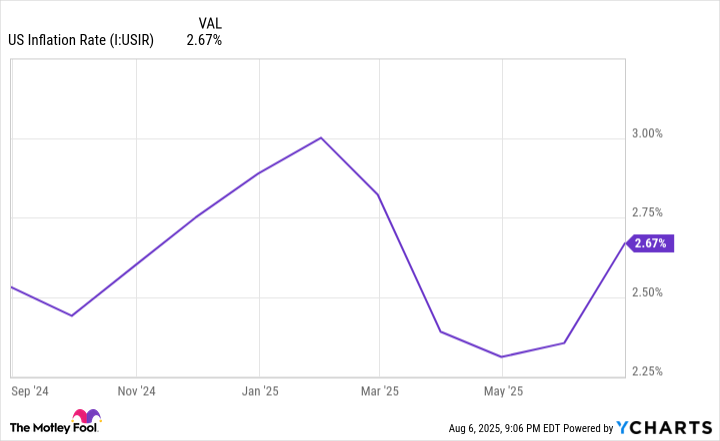
However, the June inflation report, announced in mid-July by the U.S. Bureau of Labor Statistics (BLS), pointed to an uptick in the prevailing rate of inflation — from 2.35% in May on a trailing-12-month (TTM) basis, per the Consumer Price Index for All Urban Consumers, to 2.67% in June on a TTM basis. While a 32-basis-point uptick might not sound like much, it represents the first report where the full impact of Donald Trump’s tariff policy is being felt.
President Trump’s tariff and trade policy is applying modest upward pressure on prices. US Inflation Rate data by YCharts.
According to a December-published report (“Do Import Tariffs Protect U.S. Firms?”) from four New York Fed economists working at Liberty Street Economics, the duties President Trump placed on China during his first term in 2018-2019 did a poor job of differentiating between output and input tariffs. Whereas an output tariff is placed on a finished product imported into the U.S., an input tariff is a duty applied to a good used to complete the manufacture of a product domestically. Input tariffs run the risk of meaningfully increasing costs for businesses and consumers… and this may be happening, yet again.
Following the Federal Open Market Committee’s June 2025 meeting, the Summary of Economic Projections forecast a 3.1% core Personal Consumption Expenditure (PCE) inflation rate by the end of 2025, which is up from its prior forecast of 2.8% for core PCE. In other words, inflation is expected to modestly pick up, with tariffs driving this trend.
At the same time, the BLS made a major downward revision to previously reported job gains for May and June when it released the July jobs data. May was revised down by 125,000 jobs to a gain of just 19,000, while June was slashed by 133,000 jobs to a gain of only 14,000. Though the unemployment rate of 4.2% (as of July 2025) remains near its historic low, these not-so-subtle BLS revisions intimate weakness in the job market.
Rounding things out, Liberty Street Economics’ analysis of Trump’s China tariffs in 2018-2019 found that public companies whose stock was negatively impacted on tariff announcement days produced worse future real outcomes. Specifically, companies directly impacted by these tariffs saw an average across-the-board decline in sales, profits, labor productivity, and employment from 2019 to 2021.
Based on existing economic data and historical precedent, President Trump’s tariff and trade policy is laying the groundwork for possible stagflation, with higher inflation, a weaker job market, and potentially weaker economic growth.

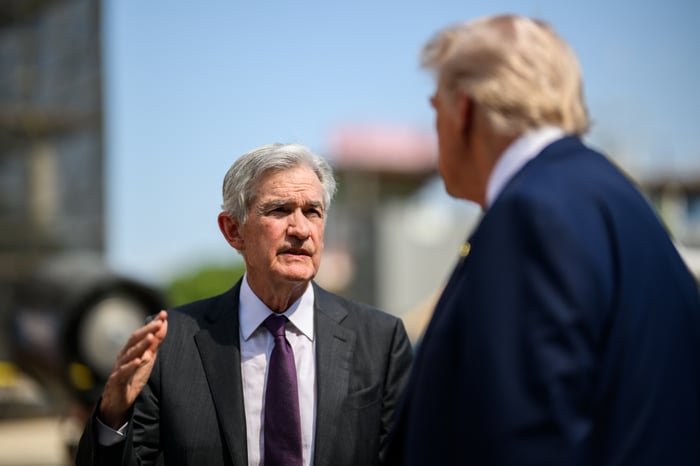
Federal Reserve Chair Jerome Powell speaking with President Trump. Image source: Official White House Photo by Daniel Torok.
The stock market’s resiliency is unparalleled
While the possibility of stagflation exists, Fed Chair Powell doesn’t believe this nightmare scenario will manifest in the U.S. “We have warned of it, but it is not something that we are facing or that we expect to face,” said Powell.
Nevertheless, certainty may be hard to come by over the coming weeks or months for Wall Street’s major stock indexes. When things are uncertain is often when the S&P 500, Dow Jones Industrial Average, and Nasdaq Composite become more volatile than usual.
But when the lens is widened and historical precedent is applied to Wall Street over a span of one or more decades, it becomes easy to see just how resilient the major stock indexes are to short-term headwinds and emotion-driven fear.
At the heart of this long-term optimism is the nonlinearity of economic and stock market cycles. Even though adverse events are inevitable and sometimes uncomfortable, they’re historically short-lived.
For instance, the U.S. economy has navigated its way through a dozen recessions since the end of World War II. The average length of these downturns is a mere 10 months, with no recession enduring longer than 18 months. In comparison, the average economic expansion has lasted for about five years, with two periods of growth surpassing the 10-year mark. Angling your portfolio to take advantage of these extended periods of growth is how significant wealth is created on Wall Street.
Speaking of stocks, this clear-as-day disparity can be seen in Wall Street’s benchmark index, the S&P 500.
It’s official. A new bull market is confirmed.
The S&P 500 is now up 20% from its 10/12/22 closing low. The prior bear market saw the index fall 25.4% over 282 days.
Read more at https://t.co/H4p1RcpfIn. pic.twitter.com/tnRz1wdonp
— Bespoke (@bespokeinvest) June 8, 2023
In June 2023, shortly after the S&P 500 was confirmed to be in a new bull market, the researchers at Bespoke Investment Group published a data set on X (formerly Twitter) that calculated the length of every bull and bear market dating back to the start of the Great Depression (September 1929).
In one corner, the average 20% (or greater) downturn in the S&P 500 has lasted just 286 calendar days, or less than 10 months. Comparatively, the average S&P 500 bull market endured for 1,011 calendar days (as of June 2023), which is about 3.5 times longer than the typical bear market.
Regardless of what’s thrown Wall Street’s way, the S&P 500, Dow Jones Industrial Average, and Nasdaq Composite always find a way to power through it over the long run. Not even stagflation fears precipitated by President Trump’s tariff and trade policy can keep these major stock indexes from hitting new highs over the long run.
Great Job newsfeedback@fool.com (Sean Williams) & the Team @ The Motley Fool Source link for sharing this story.


